Beware of the S&P 500!!
What is driving the returns in the stock market this year? There seems to be a disconnect between the economy and the stock market. These are concerns I hear frequently. You may be wondering why the annual return of a globally diversified portfolio is lagging the return of the S&P 500. You may even be asking the question of whether you should simply put all your money into the S&P 500 index, or even the Nasdaq, based on its stellar performance this year. We urge you to read on to understand why this is not a good idea.
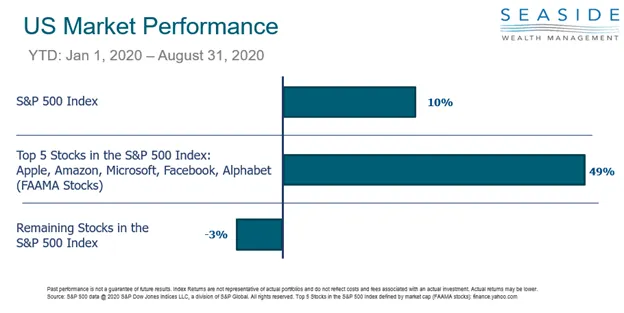
When we examined this further the results are surprising. As of August 31st the return of the S&P 500 was up about 10%, although since then the return has cooled off to about a 1% return on the year. When we deconstructed the performance calculation, we found that the top 5 performing stocks in the index were responsible for most of the positive performance of the index as a whole. Specifically, these companies have a combined return of 49% for the year! Not surprising, these are the tech heavy giants; Apple, Amazon, Microsoft, Facebook and Alphabet. The remaining 495 companies in the index are actually down 3% for the year.
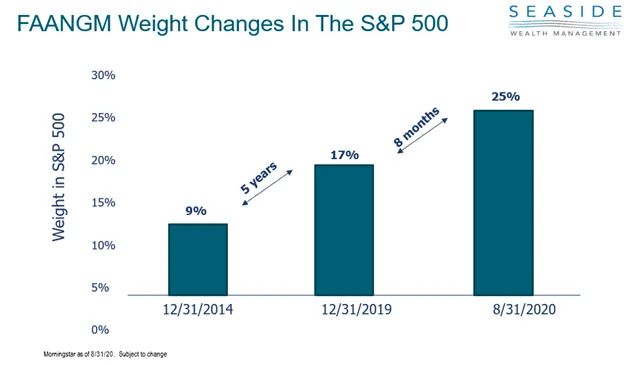
What is becoming a growing concern is the top companies in the S&P 500 represent a large percentage of the market cap of the index. The FAANGM stocks (Facebook, Apple, Amazon, Netflix, Google, Microsoft) now represent 25% of the index. That’s an incredibly large percentage into just a few companies. We know that diversification may reduce risk in a portfolio and concentration may introduce risk that we may not be aware exists.
Look at the returns on the so-called FAANGM stocks–Facebook, Amazon, Apple, Netflix, Google Microsoft. Over the 10 years from September 2010 to August 2020, a portfolio of the five stocks held in proportion to their market caps would have delivered an average annual return of 34.25% per year. That means on average, the value of the portfolio doubled about every 2.5 years.
Given their great returns over the last 10 years, what is our best guess of how the FAANGM stocks will do over the next decade? Should we expect an average annual return of almost 35% again? probably not! Who wouldn’t buy these stocks if their expected returns were 35%? But buyers need sellers. The demand driven by such high expected returns would simply push prices up and drive expected returns down to a more reasonable level. For the same reason, I’m confident that if we could go back to August 2010, we would find few investors predicting the FAANG stocks would do as well as they did from 2010 to 2020.
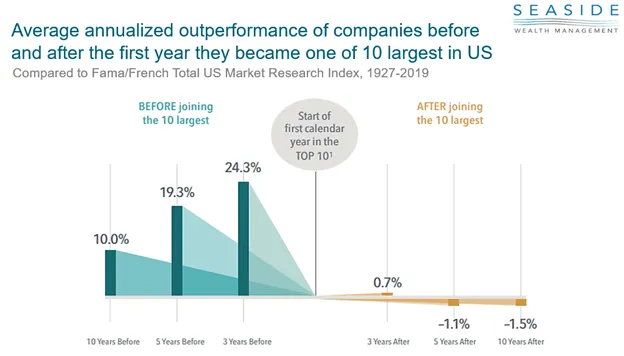
The thing to pay attention to is what happens to companies once they become the largest players in an index. Historically, they have not done as well going forward. On average, the largest companies tend to lose money once they become the largest part of an index averaging a 1.5% per year loss the following decade! Clearly, chasing after today’s hot performers is not the prudent thing to do!
So what should we do? What is the best course of action to take at this point in time?
Refer to our article on the importance of diversification
The best course of action is to maintain your discipline and remain invested in a globally diversified portfolio with many different asset classes. This is the best time to be selling your large growth companies and reinvesting the profit into the asset classes that are still down and “on sale”. Remember, we always want to sell high and buy low.
Take a look below at the comparison of a globally diversified portfolio versus the tech heavy Nasdaq index. Over the last 10 years the Nasdaq has outperformed even the S&P 500 as it contains many of the teach giants that have led the way. The Nasdaq has put up an impressive 16.7% per year return since 2010 and is up nearly 30% this year alone! Meanwhile, a globally diversified portfolio grew at 9% per year in the same time period.
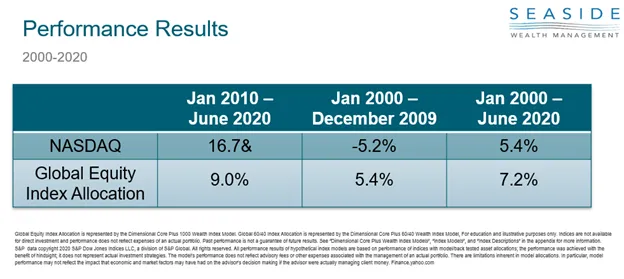
We don’t want to get sidetracked by recency bias. This is the proclivity to make decisions based on what has happened in recent memory. Don’t forget what happened from 2000-2009. The Nasdaq lost 5.2% per year for an entire decade! That would crush a financial plan. A globally diversified portfolio compounded at 5.4% per year for that decade. When we expand our time period to look back over the last 20 years we see that a globally diversified portfolio has compounded at 7.2% per year versus 5.4% per year in the Nasdaq.
While it may be tempting to chase the tech giants or even the red-hot indexes like the S&P 500 or the Nasdaq, it’s not prudent to do so. The concentration of these indexes can lead to big returns as well as big losses over the decade. A better strategy is to maintain discipline and remain globally diversified into both large and small companies as well as U.S. and international companies. While diversification can feel disappointing at times, it’s still the proven way to help you achieve your most important goals.
Read More

How To Protect Your Retirement Savings From A Market Crash

What the 'One Big Beautiful Bill' Means for Your Retirement: Key Planning Moves to Make Now

Tariffs and Your Portfolio: What You Need to Know Now

Market Update

Social Security Fairness Act: What It Means for Your Retirement