Quarterly Investment Commentary – Q1 2021
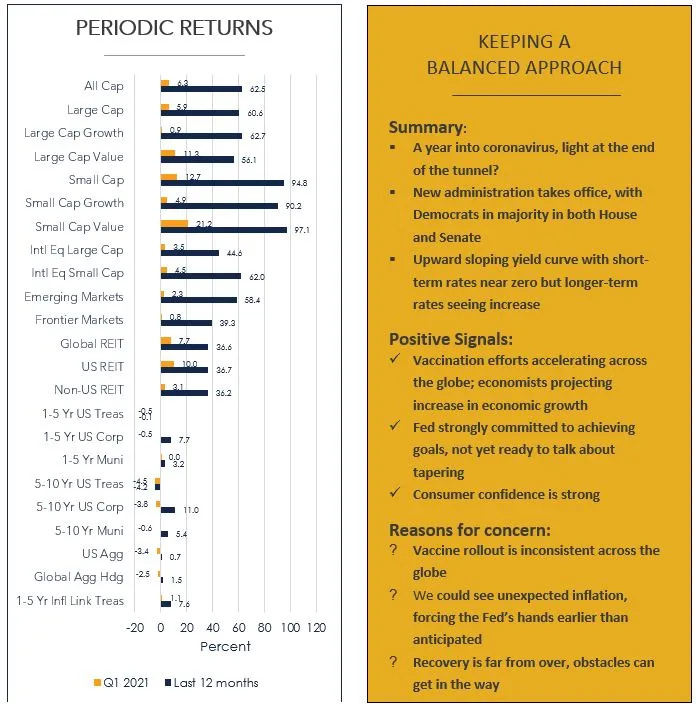
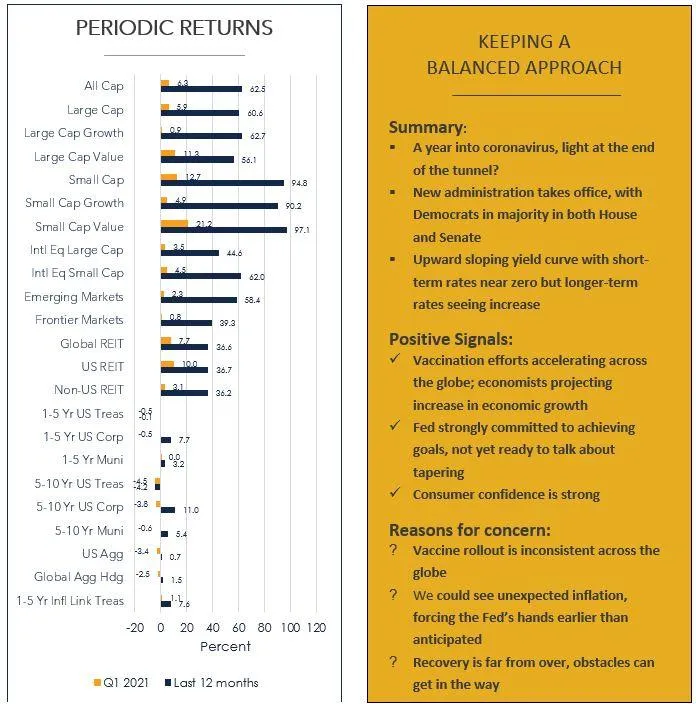
It is hard to believe that we have been dealing with Covid-19 for over a year now. Remember where we were at the end of the first quarter of 2020: the longest bull market run in history had ended, we experienced the fastest bear market in history, and we were all searching for toilet paper. Since that time, we have received timely and sizable amounts of stimulus, in the forms of fiscal and monetary policy. And yes, the last 12 month returns shown in the graph above are correct; it has indeed been quite a year.
We have continuously spoken about this from the perspective that Covid-19 is a health crisis that created an economic crisis, which really does make it different from previous downturns. And there are a lot of encouraging signs, though it would be too early and irresponsible to give the “all-clear” signal. In early November 2020, we received the first news that vaccinations were effective in global trials. Since then, the rate of vaccinations globally has steadily increased, though is still very inconsistent from country to country. Interestingly, the inconsistencies aren’t even consistent across developed and emerging countries.
Exhibit 1
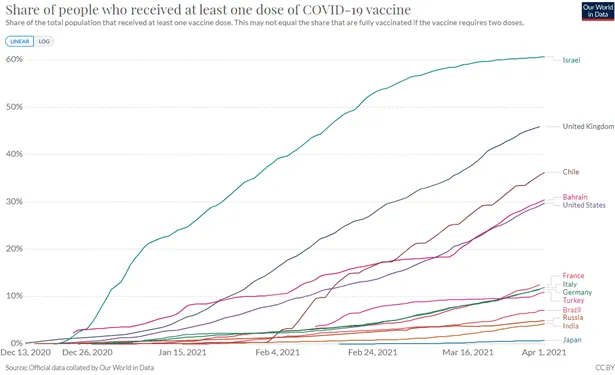
As exhibit 1 shows, developed countries like Israel, the UK, and the US have done a better job than most vaccinating larger portions of their population while other developed countries like France, Italy, Germany, and Japan have lagged. However, you also have Chile (an emerging country) and Bahrain (a frontier country) that have done relatively well while Russia and India have not been as successful in vaccinating their populations. This inconsistency creates economic concern because if timetables for vaccination slip, or we find the vaccinations are not effective against new variants, it is feasible the world will still be dealing with the pandemic and its economic impacts well into 2022 and beyond.
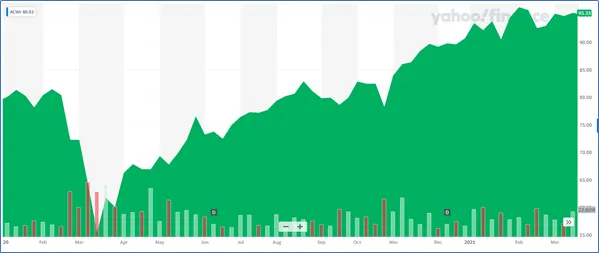
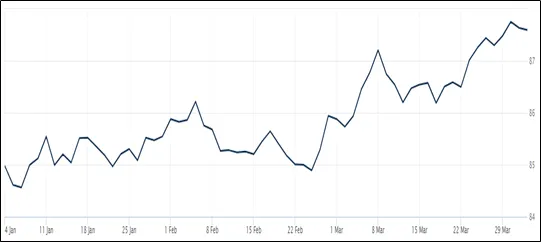
Let’s also take a look at how global equities have fared over the last year. While the previous page shows returns over the last 12 months across a variety of indexes, exhibit 2 shows the daily price movement in ACWI, an ETF that represents global equities. The time period shown is from the beginning of 2020 through March 2021. We chose this time period as a reminder of just how far global stocks dropped in March 2020, but also as a sign of how far we have come since. It is also a gentle reminder that investing in stocks can be volatile.
Exhibit 2
U.S. Equity
U.S. equities had quite a strong first quarter, which only added to the results of the previous several months. In fact, small cap equities, as represented by the Russell 2000, gained 13% for the last three months and 95% over the last 12. Part of what makes this run so astonishing is the extent to which we saw small caps lag large cap stocks in 2020, in particular at the early stages of the pandemic, only to see a meaningful reversal in such a short time period.
In addition to a reversal in stocks across capitalization, we have seen a reversal as well in stocks when you look at valuation. Both large cap and small cap value stocks have outperformed their more growth-oriented counterparts more recently. In particular, technology stocks that benefited and soared during the early stages of the pandemic have since slowed, as there are concerns these stocks are now simply overvalued. Part of the math behind the view that technology stocks are overvalued is straightforward: a share’s value is determined by its projected future cash flows discounted to the present using the investor’s required rate of return. When interest rates fall and everything else is held constant, share values should theoretically rise. However, as rates rise, assuming everything else is held constant, then share values are likely to fall.
It is possible too that technology stocks are not growing as fast simply because the returns they generated last year (and in previous years) are simply not sustainable. As the lockdowns end and economies begin to open more broadly, it makes sense that these previously high-flying companies would experience a slower pace of growth. As for value-oriented companies, they were hit hardest during the early stages of the pandemic but have since gained traction from signs of an improving economy. Plus, certain cyclical stocks like financials, actually can benefit from rising rates.
In fact, we have seen a change in sector leadership in general. In Exhibit 3, the gray bars show returns from 12/31/2019 through 11/6/2020. This date in November 2020 was chosen as it was the last business day before vaccines were revealed to be effective in global trials. As you can see, sectors like online retail, home improvement and groceries did really well during the shutdown phases of the pandemic but have struggled since. At the same time, those sectors that performed worst during the early stages of the pandemic, energy, airlines, hotels and banks, have rebounded to do very well. Overall, the development and rollouts of a vaccine have supported these cyclical sectors.
Exhibit 3
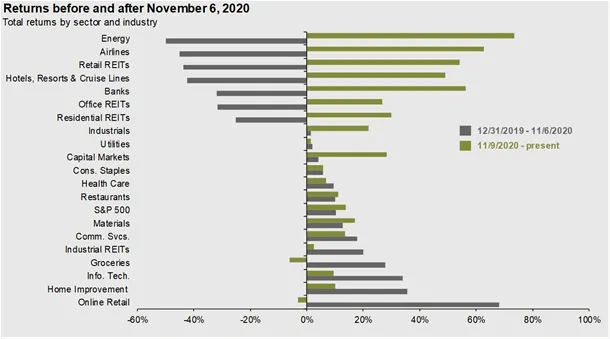
Source: FactSet, Standard & Poor’s, J.P. Morgan Asset Management. November 6, 2020 chosen as the last business day before vaccine candidate is revealed to have more than 90% efficacy against the COVID-19 virus in global trials. The company referenced is for illustrative purposes only.
JPM Guide to the Markets – U.S. Data are as of March 31, 2021.
Taken as a whole, these rapid and sizable changes in leadership, whether between growth vs. value, large vs. small, or even tech vs. energy show why it’s important to be allocated broadly across the equity universe.
Non-U.S. Equity
Over the last quarter, international small cap stocks outperformed their large cap counterparts while emerging market stocks trailed both.
From a country perspective, the countries with the largest weight in the MSCI EAFE index (Japan, UK, France, Germany, Switzerland) all underperformed the US on a relative basis. The Netherlands had the highest return (11.8%) but comprises less than 5% of the index. In the emerging markets, China remains the largest country exposure in most emerging market indexes but was flat (0.0% return) for the quarter. Other countries with larger exposures in emerging market indexes performed relatively well, including Taiwan (10.7%) and India (6.9%), though these returns were still not enough to pull the overall index ahead of either US or developed ex-US equity indexes for the quarter.
International stocks (both developed and emerging) were negatively impacted by a US Dollar that strengthened vs. a basket of its peers during the first quarter of 2021 (see Exhibit 4), which is a reversal of what we saw for much of 2020. In fact, in the developed markets, only the Canadian dollar, British pound and Norwegian Krone appreciated vs. the dollar, with all others depreciating.
Exhibit 4
Source: Wall Street Journal Dollar Index as of March 31, 2021; it shows the value of the USD relative to a basket of 16 foreign currencies
Global REITs
Global REITs, as represented by the Dow Jones Global Select REIT, generated a 7.7% return for the quarter, with U.S. REITs (10.0%) outperforming non-U.S. REITS (3.1%). Over the last 12 months, REITS have bounced back but not nearly as much as equities have in general.
Obviously, Covid-19 played a major role in the experiences of various REITS throughout the last year. With lockdowns in place and most people not traveling too far from home, it makes perfect sense that we saw significant declines in REIT sectors where social distancing is quite difficult. This includes sectors such as lodging, shopping centers and health care facilities (e.g. nursing homes). However, it is important to remember that REIT sectors are quite diversified.
Exhibit 5
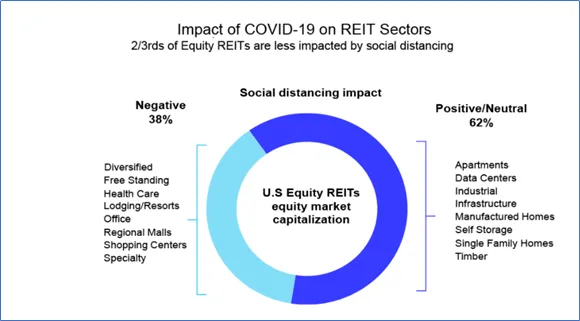
Source: Nareit analysis of equity market capitalization for equity REITs in FTSE Nareit All REIT Index and Factset monthly returns as of November 30, 2020
Per the analysis done by Nareit and shown in Exhibit 5, just less than 2/3 of REIT sectors as measured by market cap are considered to be less impacted by social distancing and includes REIT sectors like data centers, manufactured homes and self-storage facilities.
Like we have seen in equities, it is not out of the question that we will see the sectors that were hurt most by the virus and the ensuing lockdowns experience a rebound as economies continue to open up around the globe.
Global Fixed Income
Unlike equities, most fixed income indexes actually declined for the quarter, and Treasury indexes have even moved into negative territory over the last 12 months. As signs of a strengthening economy continued, we saw a steepening of the yield curve as Treasuries sold off, in particular on the intermediate and longer portions of the yield curve. As we know, yields and prices move inversely with one another, hence the negative returns across Treasuries.
As Exhibit 6 shows, the short end of the yield curve remains near zero. This makes sense as the Fed really controls this portion of the curve, and they have strongly stated they do not expect to raise rates until their objectives of full employment and an average inflation of 2% are met. Currently, popular opinion is this won’t happen until 2023.
Exhibit 6
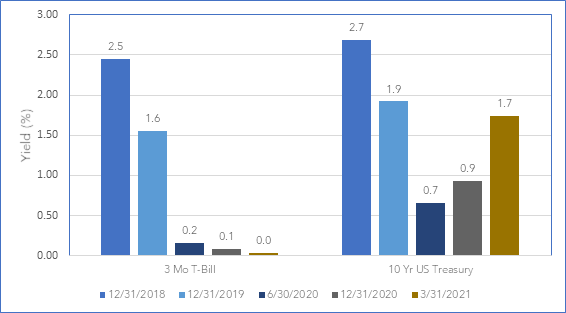
Source: Treasury.gov
Fed Chairman Powell has stated it would be “quite some time” before enough progress towards their goals is made while adding later “the economy is a long way from our employment and inflation goals.”
At the same time, we have seen yields rise in the intermediate and long-term portion of the curve, which has been driven by additional fiscal stimulus and economic growth expectations from continued vaccination efforts.
Yields started to increase in January as Democrats took control of the Senate, and with that the likelihood of increased stimulus grew, along with the belief that economic growth and inflation would follow. In fact, 10-year Treasury yields topped the 1% mark while the 30-year Treasury topped 2%, marks that had not been hit in about a year. The widening split between long- and short-term Treasuries indicates investors believe economic growth is coming and are moving towards riskier assets and away from safe-haven assets like Treasuries. At the end of the quarter, the 10 year Treasury yielded 1.74%, a level that had not been reached since January 2020.
In all, while rising rates can create negative returns in the short term for bond investors, rising rates can actually be a good thing, especially as they move higher to what is considered more normal levels, and expectations are for higher growth. In all, it can be taken as a statement of confidence in the economy and recovery overall. Furthermore, even though a rise in yields means a drop in prices, investors should benefit from receiving the higher yield going forward. Inflation continues to be a hot topic and there continue to be strong arguments for why we will (and also why we won’t) see high inflation ahead. Folks that believe that high inflation is coming simply point to the massive amounts of fiscal and monetary stimulus added to the financial system.
When you combine that with an economy that continues to open up and the possibility that supply will not be able to keep up with demand, you see rational arguments for inflation. However, skeptics have shown that rising rates do not automatically mean high inflation, especially when unemployment is still as high as it is. The reality is that we have no data to reference how the global economy will respond post-pandemic, and that includes what happens to inflation. One thing to note is that while some may remember the run-away inflation we saw in the 1970’s and be concerned we are headed there again when we discuss inflation, it is believed the Fed has the necessary tools available as well as more knowledge in order to avoid another similar scenario.
There is one important point to keep in mind over the next several months when looking at inflation data. Remember that inflation statistics are often quoted as year-over-year statistics, and with CPI data falling dramatically last May after the initial shock and awe of Covid-19, it will not be surprising to see some high year-over-year CPI statistics in the coming months. Exhibit 7 shows the level of CPI from January 2020 through February 2021, with the drop off in May 2020.
Exhibit 7
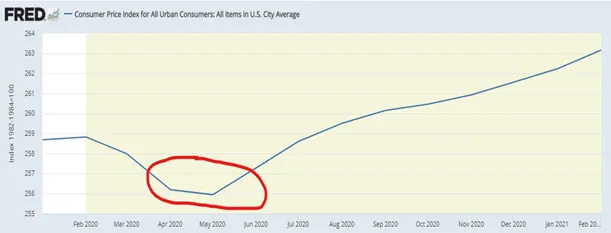
Source: U.S. Bureau of Labor Statistics, fred.stlouisfed.org
As we think about inflation, TIPS are thought of as the best hedge against inflation as the securities are literally tied to CPI, a broad measure of inflation. Some of the reasons why some inflation protection and an allocation to TIPS may be warranted today include: 1) the Fed has stated their inflation target is an average of 2% and not a 2% target as it previously was, which means inflation could be above 2% for a while, 2) a surge in economic activity could lead to an inflation surprise. On the flipside, there are also reasons why an investor may choose not to hedge against inflation via a TIPS allocation: 1) for investors that have substantial equity positions, it is generally believed that equities will outpace inflation over time, 2) TIPS perform relatively poorly when real yields rise, 3) TIPS are seen as being tax inefficient.
As we discussed in previous quarters, in order to generate more return, investors need to assume more risk. In fixed income, that means either extending duration or lowering credit quality. There are tradeoffs that have to be weighed very carefully before implementing either strategy. From a duration standpoint, extending duration too far out can be a risky move in a period of rising rates. Similarly, lowering credit quality means investing in high yield, or junk bonds, which generally correlate much more with equities and therefore don’t provide the diversification benefits we expect from fixed income.
Like Treasuries and corporate bonds, municipal bond returns mostly fell during the quarter with only short-term bonds eking out a slight, positive return.
We continue to view fixed income as a method of reducing overall portfolio risk (as measured by standard deviation), given that equities are expected to have much higher volatility. Our portfolio’s focus will continue to be on high quality bonds with an emphasis on short to intermediate duration government and corporate bonds, where default risk has historically been relatively low. For some investors, muni bonds are attractive for their tax-free income.
East Bay Investment Solutions and Seaside Wealth Management have an arrangement whereby East Bay Investment Solutions provides model recommendations on a consulting basis to Seaside Wealth Management. Seaside Wealth Management maintains full discretion and trading authority over its clients’ accounts.
This document contains general information, may be based on authorities that are subject to change, and is not a substitute for professional advice or services. This document does not constitute tax, consulting, business, financial, investment, legal or other professional advice, and you should consult a qualified professional advisor before taking any action based on the information herein. This document is intended for the exclusive use of clients or prospective clients of Seaside Wealth Management. Content is privileged and confidential. Information has been obtained by a variety of sources believed to be reliable though not independently verified. To the extent capital markets assumptions or projections are used, actual returns, volatilities and correlations will differ from assumptions. Historical and forecasted information does not include advisory fees, transaction fees, custody fees, taxes or any other expenses associated with investable products. Actual expenses will detract from performance. Past performance does not indicate future performance.
The sole purpose of this document is to inform, and it is not intended to be an offer or solicitation to purchase or sell any security, or investment or service. Investments mentioned in this document may not be suitable for investors. Before making any investment, each investor should carefully consider the risks associated with the investment and make a determination based on the investor’s own particular circumstances, that the investment is consistent with the investor’s investment objectives. Information in this document was prepared by East Bay Investment Solutions. Although information in this document has been obtained from sources believed to be reliable, East Bay Investment Solutions does not guarantee its accuracy, completeness or reliability and are not responsible or liable for any direct, indirect or consequential losses from its use. Any such information may be incomplete or condensed and is subject to change without notice.
Read More

How To Protect Your Retirement Savings From A Market Crash

Smart Money Moves to Make for 2026

26 Things To Consider In 2026

Smart Year-End Money Moves to Strengthen Your Financial Future

What to Do With an Inheritance: Smart Moves for Wealth Preservation