Quarterly Investment Commentary – Q3 2021

When is transitory inflation no longer transitory?
Last quarter we wrote a lot about inflation; in particular how the Fed has labeled current inflationary pressures as transitory (i.e. temporary) and they were open to “talking about talking about tapering”. Since then, CPI, one gauge of inflation, increased 5.4% year over year in June and then again in July (which was the highest 12-month increase since August 2008), with a slightly lower 5.3% increase in August (source: Bureau of Labor Statistics). Each of these readings are well above the 2% average inflation targeted by the Fed (note: while CPI is a main gauge of inflation, the Fed actually uses a different measure, called PCE, which is also currently elevated over 2%).
Let’s remember that earlier in the year when we first started seeing higher CPI results, we were working through the first stages of reopening the economy as well as seeing the impact from extraordinarily low CPI from the year prior (i.e. the base effect). When the Fed labeled the higher inflation as transitory, the expectation was that CPI would be more muted as year-end 2021 approached.
To understand how the Fed feels about higher inflation, Fed Chairman Powell stated in July “This is a shock going through the system associated with reopening the economy, and it has driven inflation well above 2%. And of course we’re not comfortable with that.”
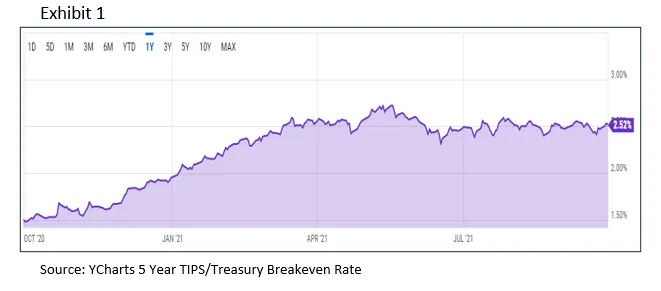
To be clear, using the 5-yr breakeven inflation rate in Exhibit 1 as a guide, investors are not expecting inflation to remain elevated for many years to come. In fact, the 5-yr breakeven inflation rate stood at 2.52% as of October 1, 2021.
What does higher inflation mean for monetary policy?
The Fed announced in September that they believe they may be ready, as soon as November 2021, to start reversing their easy monetary policies. The first step will be to taper, which is to reduce the amount of asset purchases they make. As an analogy, this is akin to the Fed taking their foot off the accelerator. This is different from pumping the brakes (which would be more equivalent to raising rates). It is also important keep in mind that the process of tapering is not directly tied to the Fed raising rates (i.e. rates don’t have to rise simply because the Fed finishes tapering), though it is expected that tapering occurs before any interest rate increases.
Fed watchers now put a lot of emphasis on the Fed’s dot plot, which is supposed to map out expectations for where interest rates are headed in the future.
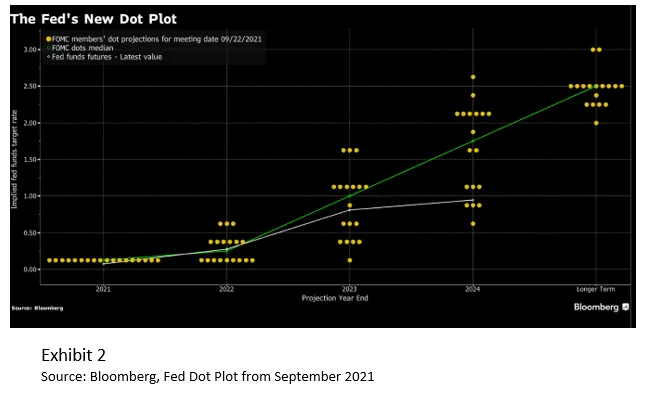
As Exhibit 2 shows, the most recent dot plot has nine of the 18 Fed officials expressing their view that interest rates will start to increase sometime in 2022, which is up from four back in March 2021. Remember, one of the ways to fight higher inflation is to be “hawkish,” which basically just means that higher interest rates can reduce inflation (i.e. higher interest rates means higher borrowing costs, which is expected to lead to less borrowing and a slower economy). The theory is that the Fed is looking to start the tapering process soon, so that they can also raise rates sooner than expected if inflation proves to be stickier and not as temporary as initially believed. In other words, the Fed is looking for more flexibility if needed.
There are still many outstanding questions. For one, when we will see supply chain bottlenecks ease? How quickly will the Fed taper? Will we see inflation decrease on its own over the next several months? We said this last quarter and feel it bears repeating: inflationary psychology can become a self-fulfilling prophecy, because, at least in part, as consumers spend more on goods they expect to be more expensive in the future, the speed in which money changes hand (i.e. velocity of money) increases, which could boost inflation further, all else being equal.
U.S. Equity
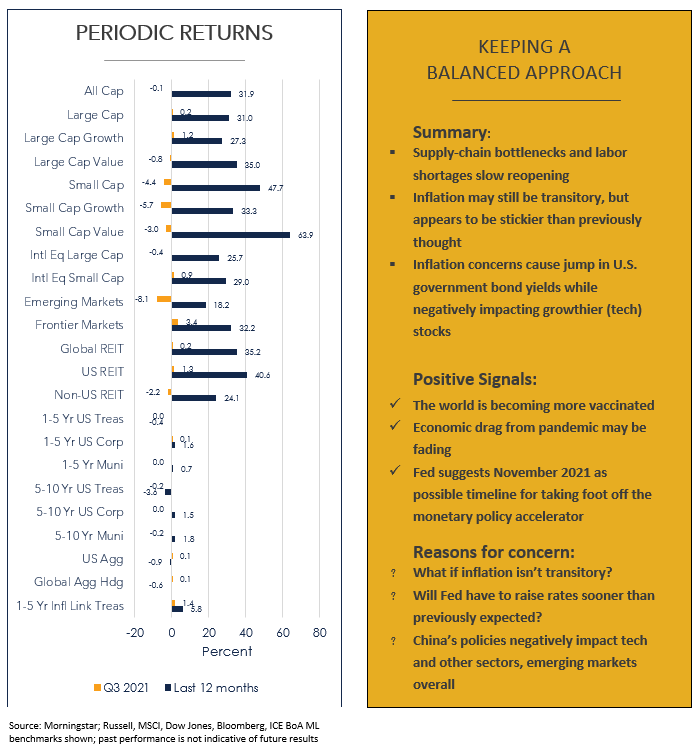
We ended last quarter’s U.S. equity section by mentioning the year-to-date returns were generally well above what we might expect for an entire year and that while a continued upward trajectory is certainly possible, it is normal for there to be at least one intra-year decline. Well, we saw some minimal decline across U.S equities broadly as the Russell 3000 fell by -0.1% for the quarter.
While there is not one sole reason the rally stalled, issues with global supply chains, worries about inflation, and a general concern that the pace of economic growth has weakened can all be considered likely culprits. Similarly, as the Delta variant spread throughout the summer months, the potential for new restrictions or reduced consumer spending also weighed on investors’ minds.
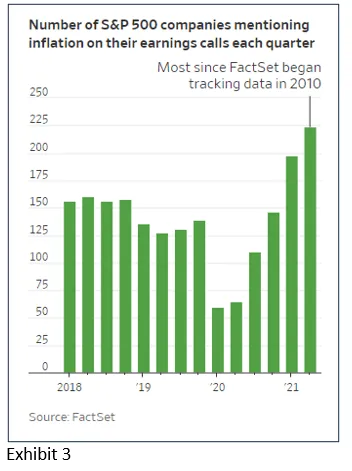
Going back to the inflation conversation, Exhibit 3 shows that inflation has become a specific concern of large cap companies if you consider that almost half of the companies in the S&P 500 had mentioned inflation during their most recent quarterly earnings call. Per FactSet, this is the highest number since they began tracking this data in 2010. This is important because these companies all must think about inflation, and its impact, when it comes to how they set prices, wages and other financial considerations.
Even with all of that, large cap stocks still eked out a positive return with the Russell 1000 moving up 0.2% and the S&P slightly better at 0.6%. For the quarter, the Russell 1000 Growth (+1.2%) outpaced the Russell 1000 Value (-0.8%), though that trend started to reverse towards the end of the quarter as interest rates crept up. Part of the thinking here is that when rates are low, as they have been, investors are willing to pay more for larger expected future profits, which benefits growth companies. However, when rates rise, investors are less willing to do so, which we saw negatively impact large cap growth stocks towards quarter end.
In small caps, while June marked the 9th consecutive month of positive returns, a span in which the index jumped by 54%, that streak came to an end in July, when the index fell by -1.5%. Small cap growth stocks fell by -5.7% for the quarter and have only gained 2.8% year-to-date while small cap value stocks have performed much better. While small cap value stocks also fell by -3.0% for the quarter, they have increased by 22.9% year-to-date.
Non-U.S. Equity
Developed large cap (-0.4%), developed small cap (0.9%) and emerging market stocks (-8.1%) saw mixed results for the quarter. Year-to-date returns are still quite positive for developed large cap (8.3%) and developed small cap (10.0%) while emerging markets fell into negative earning territory on a YTD basis (-1.2%). At least some of non-U.S. equities’ underperformance versus their U.S. counterparts can be attributed to the stronger dollar we saw over the quarter, as we know a stronger dollar hurts international equity returns.
From a country perspective, the countries with the largest weight in the MSCI EAFE index (Japan, UK, Germany) saw mixed results, returning 4.4%, -0.2%, and -3.8% respectively. Emerging market country returns saw wide dispersion with Argentina gaining 17.1% while Brazil dropped -20%. China was the second worst performing emerging market country, declining -18%.
While China remains the largest country exposure in the emerging markets index by far, it fell from being 37.5% of the MSCI EM Index at 6/30/21 to 33.6% at 9/30/21. Most of China’s slide occurred towards the end of July when the Chinese government introduced new regulations that negatively impacted technology companies, online tutoring companies, among others. There are many layers to this story but a desire for “common prosperity” is a theme that runs throughout. At the same time, the Chinese government is using this opportunity to do something about their concerns with data security, privacy, and even national security.
With what is currently happening in China, a common question is whether we should still be investing in China or not. While we still believe in the merits of investing in China, let’s put this all in more perspective.
For one thing, the Chinese economy is the second largest in the world, only behind the U.S. From that perspective, China is simply too large to ignore. Also, if we were to simply ignore it by investing in emerging market ex-China, that has the unintended consequence of increasing the size of all the other countries in the emerging markets index.
Similarly, we should expect to see greater amounts of volatility in China. For instance, JP Morgan Asset Management calculations show that on average, the MSCI China index has experienced intra-year drops of -29.7% in local currency. As a comparison, average intra-year declines for the S&P 500 are only -14.3%, or less than half of what China experiences.
Finally, let’s put allocation to Chinese stocks in perspective from a total portfolio view. For this example, let’s assume an investor has 60% invested in equities. If we assume the current market cap weighting of emerging markets (12%, per JP Morgan as of 9/30/21) and China as 33.6% of the index (referenced earlier), the investor has roughly just under 2.5% of their portfolio invested in Chinese stocks, which are comprised of many different holdings.
In all, we currently still believe that investing in China, and emerging markets in general, is an important aspect of an investor’s portfolio. At the same time, we should also expect more volatility in China and emerging markets.
Global REITs
Global REITs, as represented by the Dow Jones Global Select REIT, generated a barely positive 0.2% return for the quarter with U.S. REITs (1.3%) outperforming non-U.S. REITS (-2.2%). Over the last 12 months, global REITS are still one of the highest performing sectors with a 35.2% return.
Global Fixed Income
Most fixed income indexes saw flat to negative returns during the quarter. However, short term inflation-linked Treasuries gained the most (1.4%) with high yield corporate bonds (0.9%) right behind over the last three months.
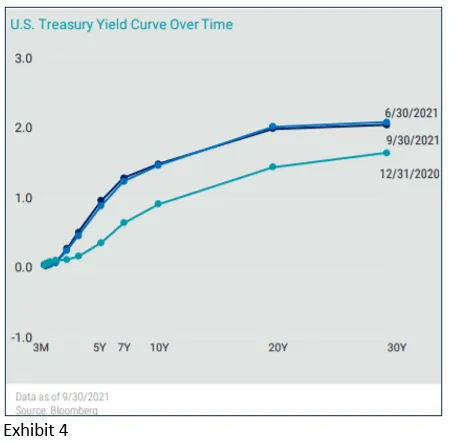
While Exhibit 4 shows there wasn’t much change in the yield curve from the end of last quarter end to this quarter end, there was quite a bit of movement intra-quarter. In fact, the 10-year yield dropped all the way down to 1.19% in early August, an almost 30 bps decline from June month end as the Delta variant, labor shortages and supply-chain issues caused concern about a slowing economy. Another potential reason for declining yields is that investors were listening to the Fed and preparing for them to taper. This is an example of not only how oddly the bond market can work sometimes, but also how different it can react from what is expected, at least compared to a past similar situation. Think of what is happening this way: the economy goes into recession from a global pandemic, forcing the Fed to lower short-term rates and have easy monetary policies, fast forward to where we are now with the Fed talking about eventually having to taper and later raise rates, the idea that tighter monetary policy may be coming causes investors’ concern that higher rates will harm the economy, causing the Fed to just cut rates again. What makes this so interesting is that in 2013, when the Fed last tried to prepare the markets for tapering, 10 year yields initially soared (known as the taper tantrum) before settling back down again at a later date. The idea of falling rates is also counterintuitive to expectations as normally we would see interest rates rise with rising inflation expectations.
Which brings us to the end of September, specifically the last six trading days when 10-year Treasury yields jumped from 1.32% to 1.52% and 30-year yields rose from 1.84% to 2.08%. The timeline of this increase matches with the Fed’s announcement that they may raise interest rates sooner than previously expected (the earlier notes on the Dot Plot reference this) in light of the possibility that higher inflation may also be here longer than previously expected.
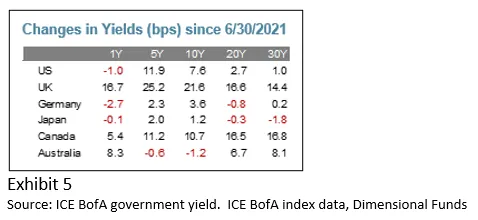
So that investors are not 100% exposed to just US interest rate risk, we also believe that an allocation to non-US fixed income can also be a benefit to many portfolios. While we don’t expect much change in absolute performance returns when adding non-US fixed income, we do believe the allocation can reduce the risk of the overall portfolio. We know that economies from various countries move through different cycles at different times; this includes changes to the overall level of yields and their direction. As an example, Exhibit 5 shows how yields have changed for several developed economies since the end of last quarter. It is also important to note that different from equity exposure, we prefer to hedge non-US fixed income exposure so as to limit the volatility that currencies bring.
As we discussed in previous quarters, in order to generate more return, investors need to assume more risk. In fixed income, that means either extending duration or lowering credit quality. There are tradeoffs that have to be weighed very carefully before implementing either strategy. From a duration standpoint, extending duration too far out can be a risky move in a period of rising rates. Similarly, lowering credit quality means investing in high yield, or junk bonds, which generally correlate much more with equities and therefore don’t provide the diversification benefits we expect from fixed income.
Municipal performance was mixed for the quarter and for the last one year. For the last one year period, longer term munis have outpaced corporate bonds but shorter term munis have fallen behind their corporate counterparts.
We continue to view fixed income as a method of reducing overall portfolio risk (as measured by standard deviation), given that equities are expected to have much higher volatility. Our portfolio’s focus will continue to be on high quality bonds with an emphasis on short to intermediate duration government and corporate bonds, where default risk has historically been relatively low. For some investors, muni bonds are attractive for their tax-free income.
East Bay Investment Solutions and Seaside Wealth Management have an arrangement whereby East Bay Investment Solutions provides model recommendations on a consulting basis to Seaside Wealth Management. Seaside Wealth Management maintains full discretion and trading authority over its clients’ accounts.
This document contains general information, may be based on authorities that are subject to change, and is not a substitute for professional advice or services. This document does not constitute tax, consulting, business, financial, investment, legal or other professional advice, and you should consult a qualified professional advisor before taking any action based on the information herein. This document is intended for the exclusive use of clients or prospective clients of Seaside Wealth Management. Content is privileged and confidential. Information has been obtained by a variety of sources believed to be reliable though not independently verified. To the extent capital markets assumptions or projections are used, actual returns, volatilities and correlations will differ from assumptions. Historical and forecasted information does not include advisory fees, transaction fees, custody fees, taxes or any other expenses associated with investable products. Actual expenses will detract from performance. Past performance does not indicate future performance.
The sole purpose of this document is to inform, and it is not intended to be an offer or solicitation to purchase or sell any security, or investment or service. Investments mentioned in this document may not be suitable for investors. Before making any investment, each investor should carefully consider the risks associated with the investment and make a determination based on the investor’s own particular circumstances, that the investment is consistent with the investor’s investment objectives. Information in this document was prepared by East Bay Investment Solutions. Although information in this document has been obtained from sources believed to be reliable, East Bay Investment Solutions does not guarantee its accuracy, completeness or reliability and are not responsible or liable for any direct, indirect or consequential losses from its use. Any such information may be incomplete or condensed and is subject to change without notice.
Read More

How To Protect Your Retirement Savings From A Market Crash

Smart Money Moves to Make for 2026

26 Things To Consider In 2026

Smart Year-End Money Moves to Strengthen Your Financial Future

What to Do With an Inheritance: Smart Moves for Wealth Preservation